Reporting Portal FAQ
2. What is the Patient Experience Survey?
The New Zealand Patient Experience Survey Programme is designed to assist the health sector in improving the quality of health care services in New Zealand by enabling patients to provide feedback that can be used to monitor and improve the quality of health services. It has been run by the New Zealand Health Safety and Quality Commission (the Commission) since 2014. It consists of two regular surveys, the Adult Primary Care Survey (APCS) and the Adult Hospital Survey (AHS).
The feedback provided by patients through these surveys supports improvement to quality and safety by:
- Enabling local district health boards (DHBs), primary health organisations (PHOs), and primary care practices to use survey results to continually improve their services;
- Providing the Commission and the Ministry of Health with data to inform policy development and strategies for improving the performance of health services; and
- Strengthening the accountability of health services to the community.
3. Where can I get information about how the survey was conducted?
Patients are invited to take part in the surveys via email or text message. Some patients who visited a hospital or practice during the survey reference period receive an invitation email to participate in the survey. A small number may also receive a text message invitation to participate. These will be allocated to boost response rate among subgroups with lower response rates, such as Māori and Pacific peoples.
4. How often are the surveys conducted?
The New Zealand Patient Experience Surveys are conducted nationally every three months.
5. How can I access more detailed methodological information?
6. How can I see the survey questionnaires?
7. How did COVID-19 impact the surveys?
Due to the COVID-19 pandemic, the initial phase (planned for May 2020) of fieldwork with patients was delayed until August 2020. Questions adapted for COVID-19's impact on service delivery have been added to the surveys to include the pandemic's impact on patient experience in ongoing tracking.
This means that what had been intended to be the refreshed baseline measure for the revised survey will not reflect the ‘norm’ of New Zealand’s health care system. Reporting in future waves will make note of this for tracking and trend purposes; however, the experience and changing nature of health care during this pandemic provide an excellent opportunity to review core concepts of patient experience. The added questions are mostly in the Adult Primary Care Survey (APCS), which focuses on a more whole system view of health care.
8. What data will I have access to in the reporting portal?
Each DHB will have access to:
- their own DHB’s results;
- the results of the PHOs within their region;
- the results of the facilities within their region; and
- national results.
Each PHO will have access to:
- their own PHO’s results;
- the results of the practices reporting to their PHO; and
- national results.
Each facility-level user will have access to:
- their own facility’s results;
- the results of their PHO overall; and
- national results.
Each user will be able to view and switch between Quarterly and Annual Results on each of the pages
Key difference between 12-Month Annual Average and the Annual Results
The quarterly reporting 12-Month Average uses the average of the summarised quarter results whereas the Annual Results figure is calculated directly from the cases.
PLEASE NOTE: The results have been rebased to exclude answer codes 95 (those who did not want to be involved), 98 (unsure / don't know) and 99 (no response). The respondents who have answered that “they did not want to be involved”, “don’t know” or those who did not give a response when asked to, need to be excluded so the result reflects those who actually wanted to be involved. If we leave them in, we would be looking at the proportion of all patients rather than just as a proportion of those who wanted to be involved. This will lower the results incorrectly.
9. Can I download data or print results?
Yes, you can download and print the following from the Reporting Portal;
- Historical data - only at DHB and PHO level (an Excel Workbook of your organisation’s results prior to Q1 2020 will be generated);
- Performance Summary (a PDF copy of the performance summary page will be generated and sent to your email address);
- Results PDF (a PDF file of the results will be generated and sent to your email address);
- Results XLSX (an Excel Workbook of case-level data for your own analysis will be generated and sent to your email address).
This can be done on the "Survey results" page for your DHB/PHO/facility. Request the download of the results at the bottom left-hand navigation pane by clicking on either “Historical data”, “Summary PDF”, or “Results PDF” for a version with stacked-bar charts providing full comparisons, or “Results XLSX” for an Excel Workbook. The PDFs will be generated and sent to your email address, so you can print them from there.
10. Will I have access to Historical data in the Reporting Portal?
Yes, you can download the Historical data at DHB or PHO level on the Survey Results page. Request the download of the results at the bottom of the left-hand navigation pane by clicking on “Historical data”. An Excel Workbook of your organisation’s results prior to Q1 2020 will be generated and you can open and print it.
11. How can I easily identify key questions where my facility has seen a significant increase/decrease compared to the previous survey?
The "Overview" page will show a scatter plot that shows how the questions compare to the previous quarter and if there are any significant differences. The "Performance Summary" pages allows users to order questions based on where there have been the largest changes in results between the most recent quarter and previous quarters.
12. How can I easily identify key questions where my facility differs significantly from the National average?
The "Overview" page will show a scatter plot that shows how the questions compare to the National results and if there are any significant differences. The "Performance Summary" page allows users to order questions based on the difference between the user’s organisation results and the National results.
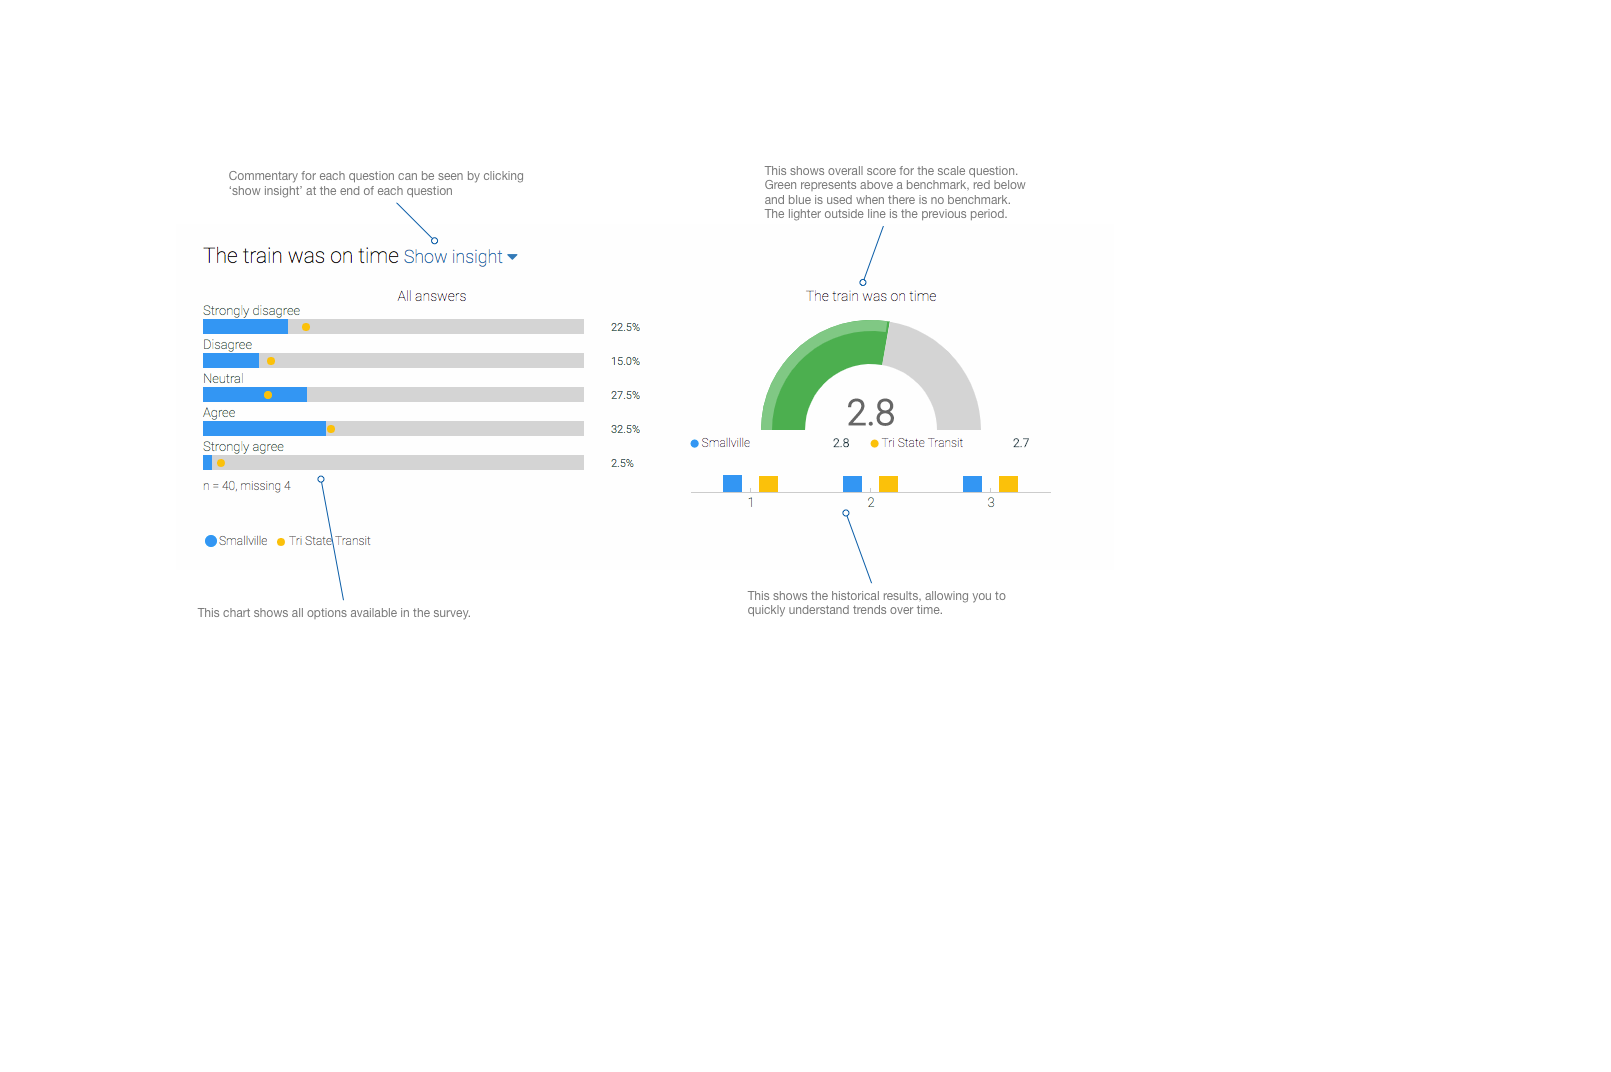
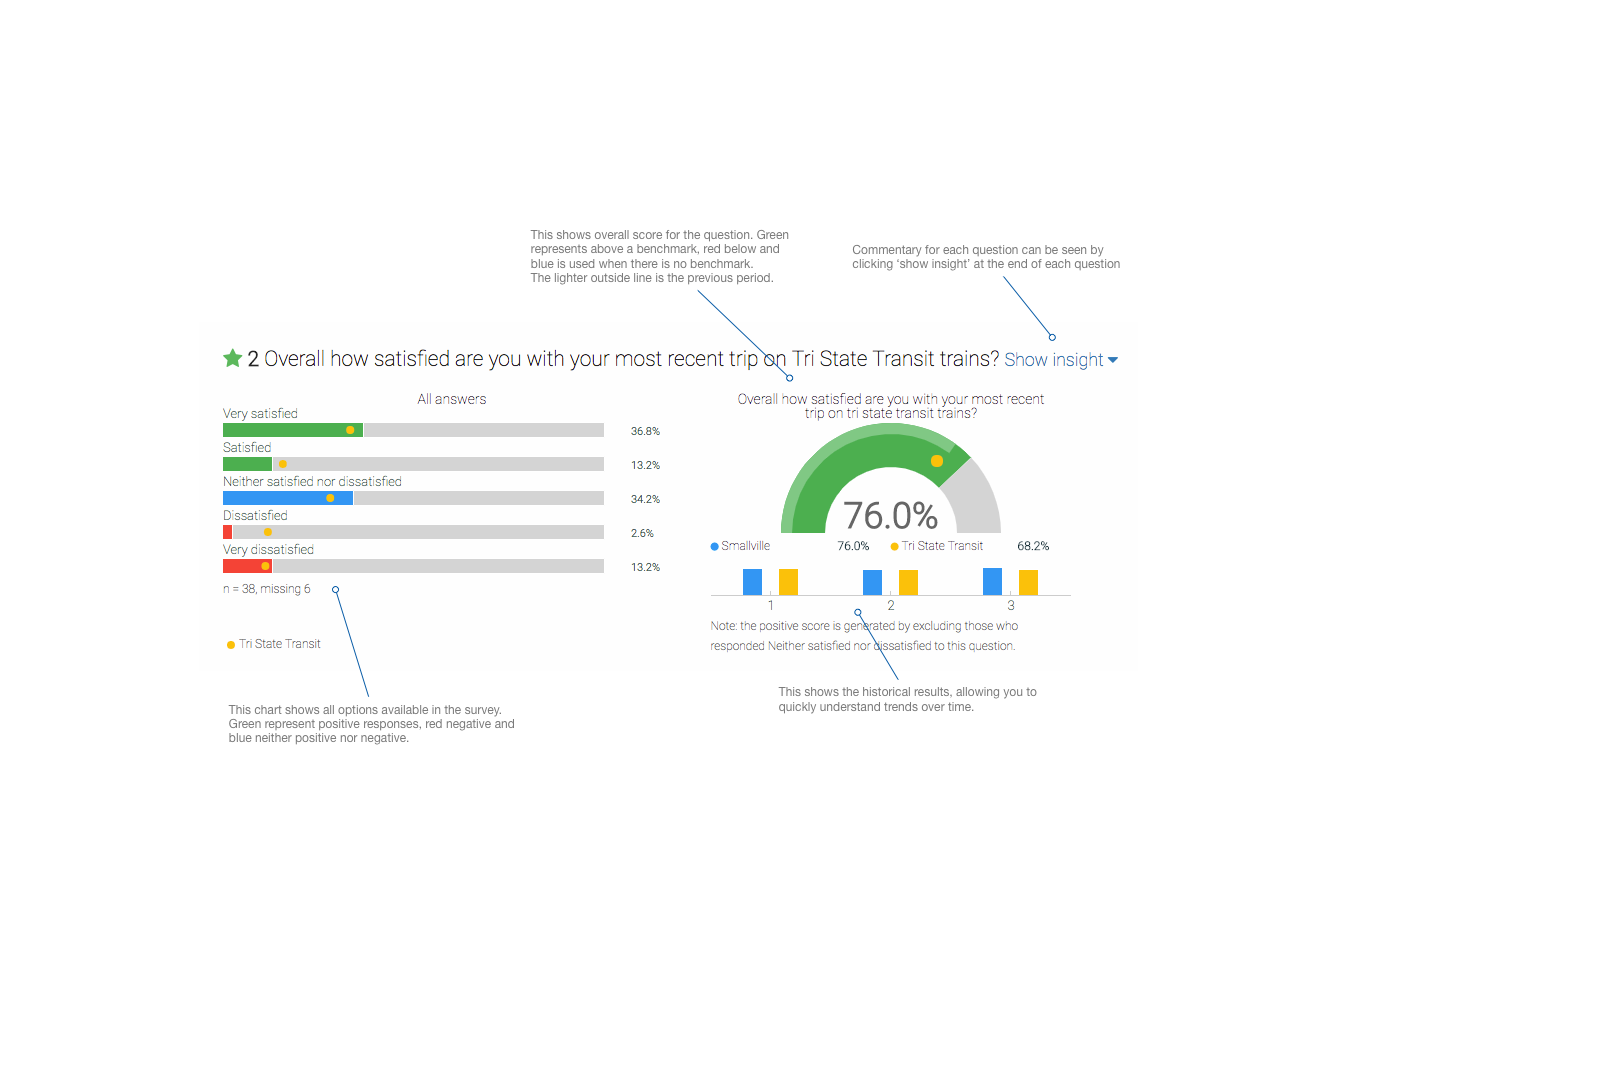
Statistically significant differences compared to the National results are indicated below each dial chart on your "Survey Results" page. For more information on how to interpret charts, please see the How-to Guide at the top of this page.
13. How are the results being protected?
All information is stored on an encrypted New Zealand server and protocols are in place to maintain a high standard of security throughout the survey administration and reporting processes.
The Commission has strict requirements in place for Ipsos and its partners to adhere to with respect to the handling of personal identifiable information (PII) and your survey responses.
14. How is data privacy protected through results suppression?
Subgroup results will only be reported if the group is sufficiently large enough to ensure that individual confidentiality is preserved. Any result with fewer than 5 responses is hidden.
15. Weighting methodology for HSI reporting.
Weighting of results for the HSI report uses the population structure who had a qualifying encounter with the primary care service provider they are enrolled with during the survey period. It compares this with the sample structure (i.e. those who responded to the survey). This creates a co-efficient that is applied to the results of the survey. This then increases or decreases a particular weighted result. This approach is distinct from standardisation. We are not seeking to compare DHBs, age groups, genders or ethnic groups with each other using this method. Rather we are seeking to weight so results accurately reflect the views of a representative local population (those who had a qualifying encounter with the primary care service provider they are enrolled with).
Weighted results for individual questions give different values to responses, effectively reflecting how many patients of a particular age group, gender and ethnic group within a DHB each respondent is representing. The more over-represented a particular group among the respondents is, the fewer total patients each respondent represents and thus the response is down-weighted, and vice versa.
16. How can colleagues of mine request access to the reporting portal?
Please contact your DHB or PHO superuser/main contact for the NZ Patient Experience Survey to request access to the reporting portal. They can send an invitation email to the new user or ask Ipsos to do it.
17. The portal is running quite slowly on my computer. Why is this?
This may be due to the internet browser you are using. The portal supports older versions of Internet Explorer down to IE11, as well as Chrome, Safari and Firefox. However, the portal will run more efficiently on newer browsers, and the best user experience can be achieved using Google Chrome. You can download Google Chrome here:
https://www.google.com/chrome/
18. How can I provide feedback on the reporting portal?
Any questions and feedback you have about the reporting portal can be directed to the Ipsos NZ Patient Experience team through:

